One dashboard framework instead of fifty dashboards
The system underneath Analytics Studio. A component framework for charts, filters, date ranges and states that let teams assemble consistent dashboards instead of designing each one from scratch.
The problem
Every team wanted a dashboard and every dashboard was becoming a bespoke design project. Charts disagreed about colors, date pickers disagreed about behavior, and empty states mostly did not exist.
What we built
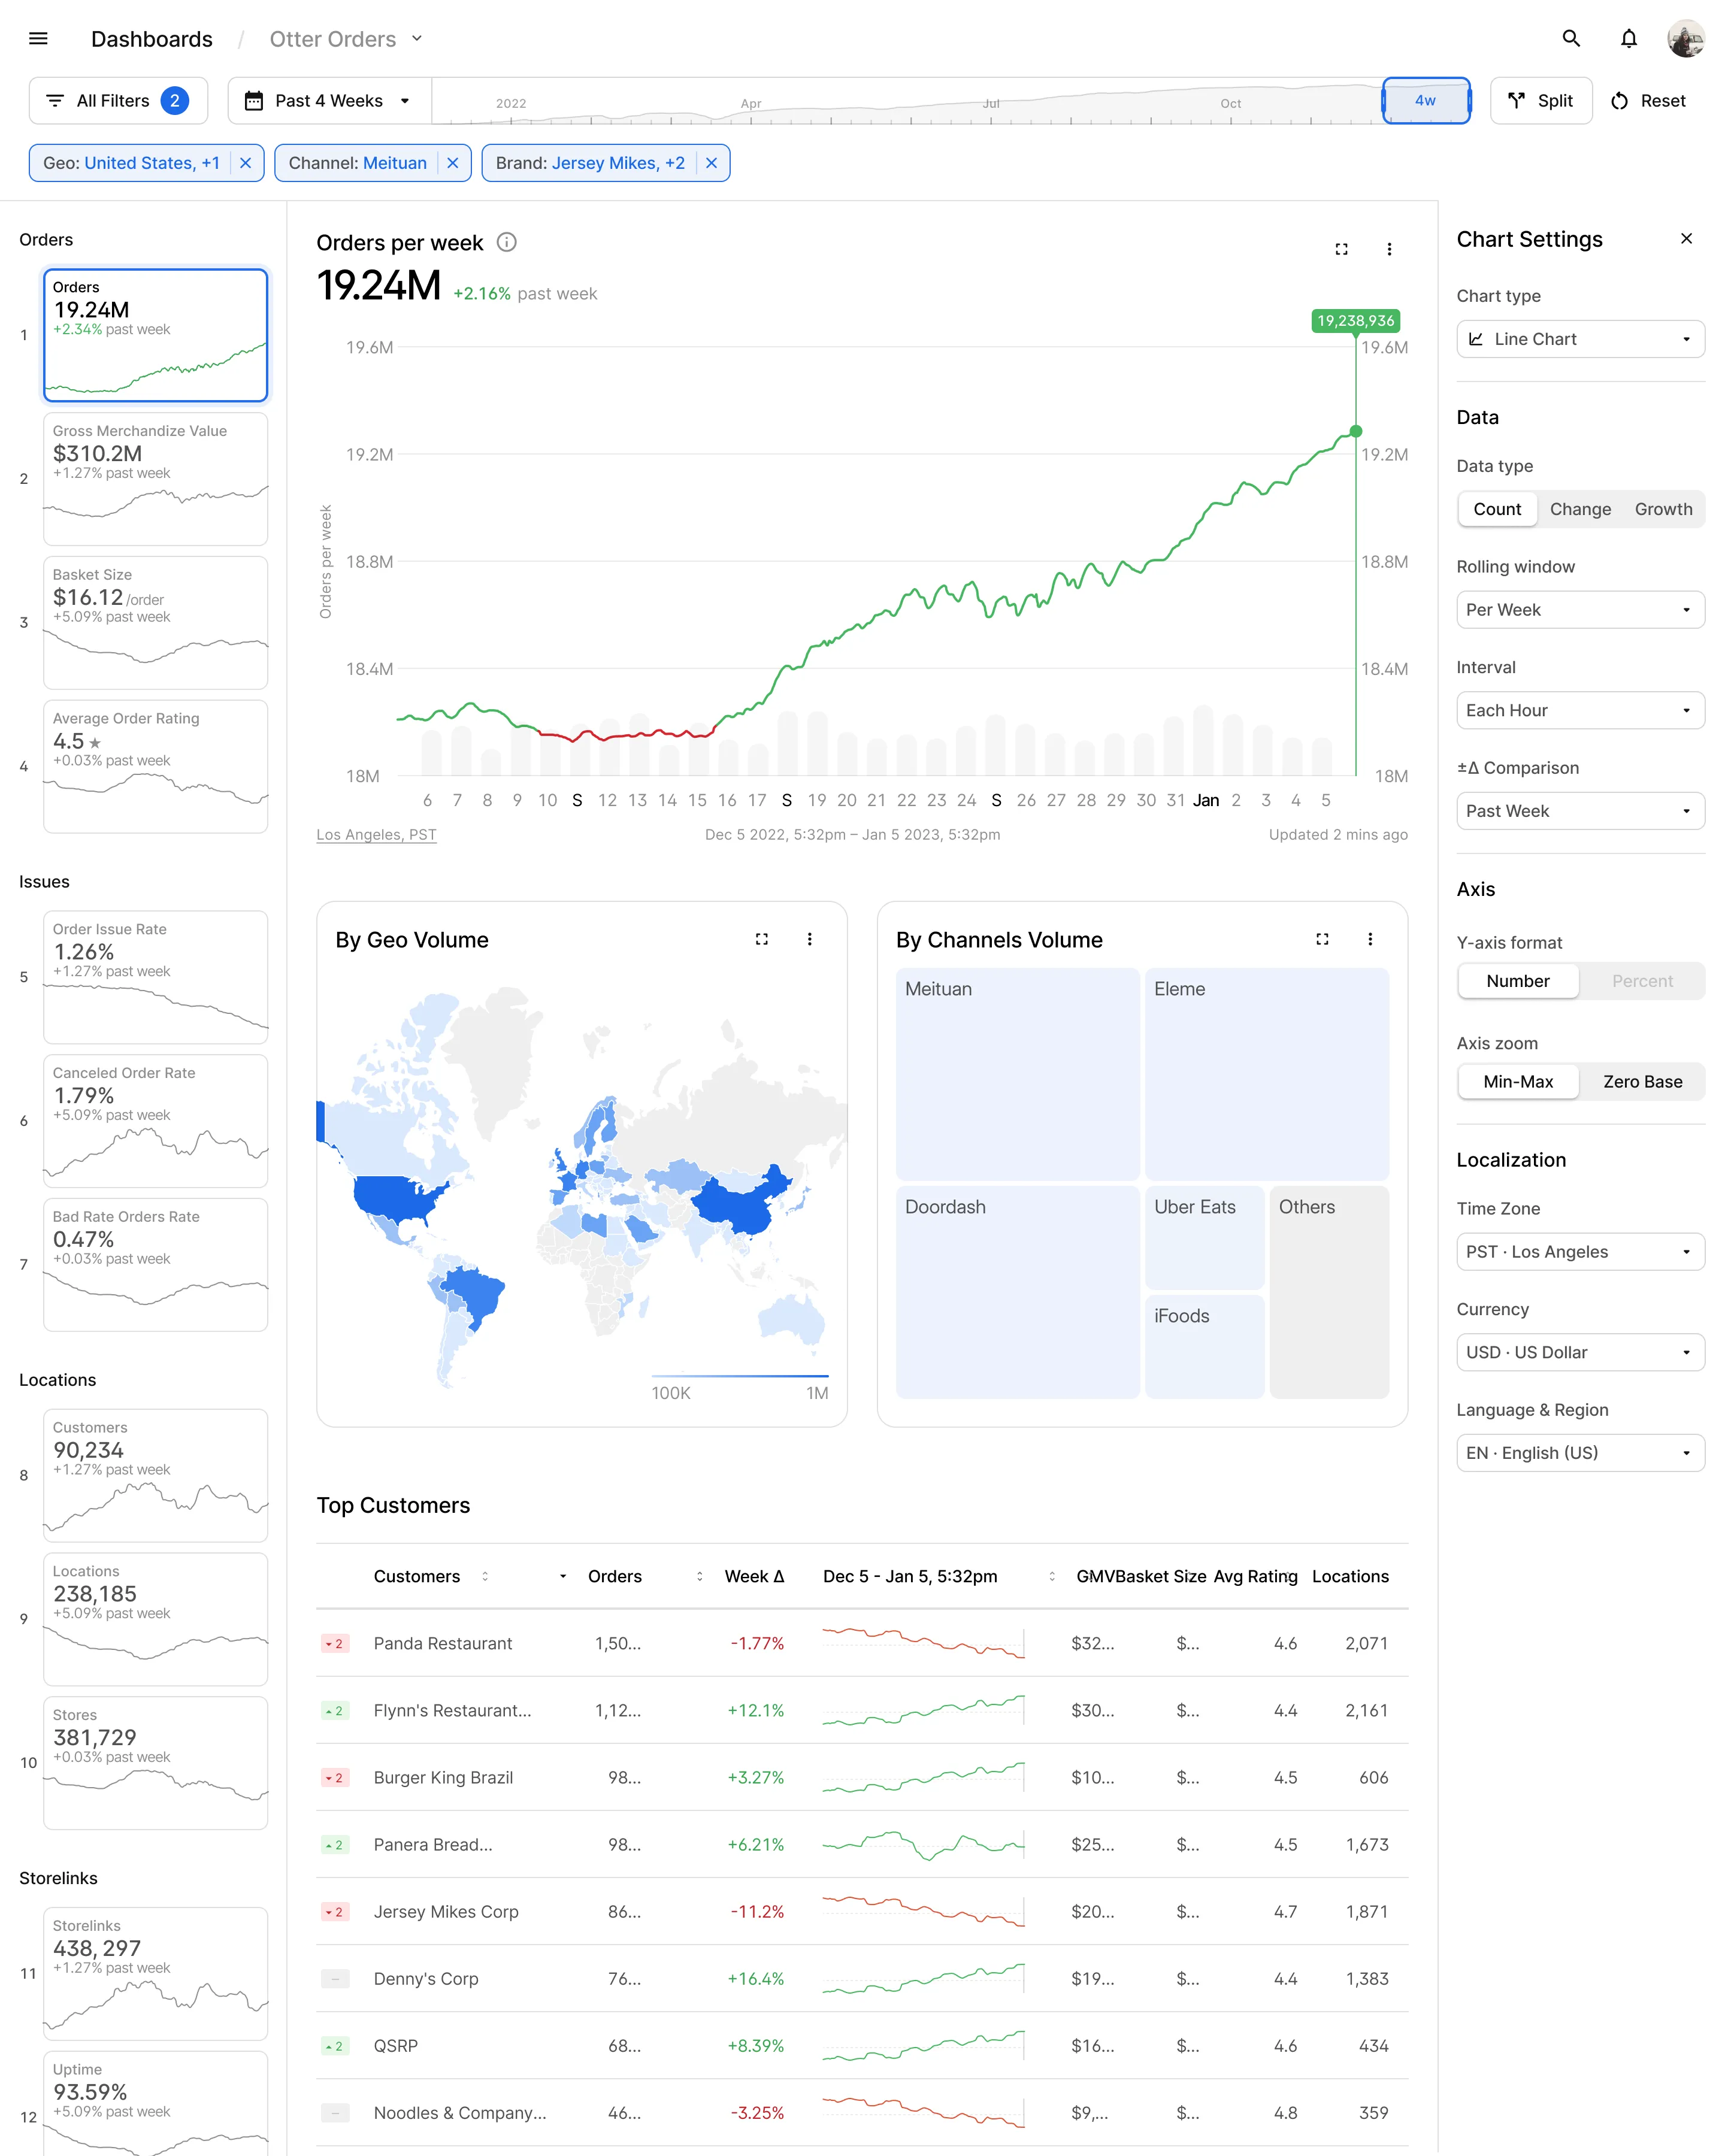
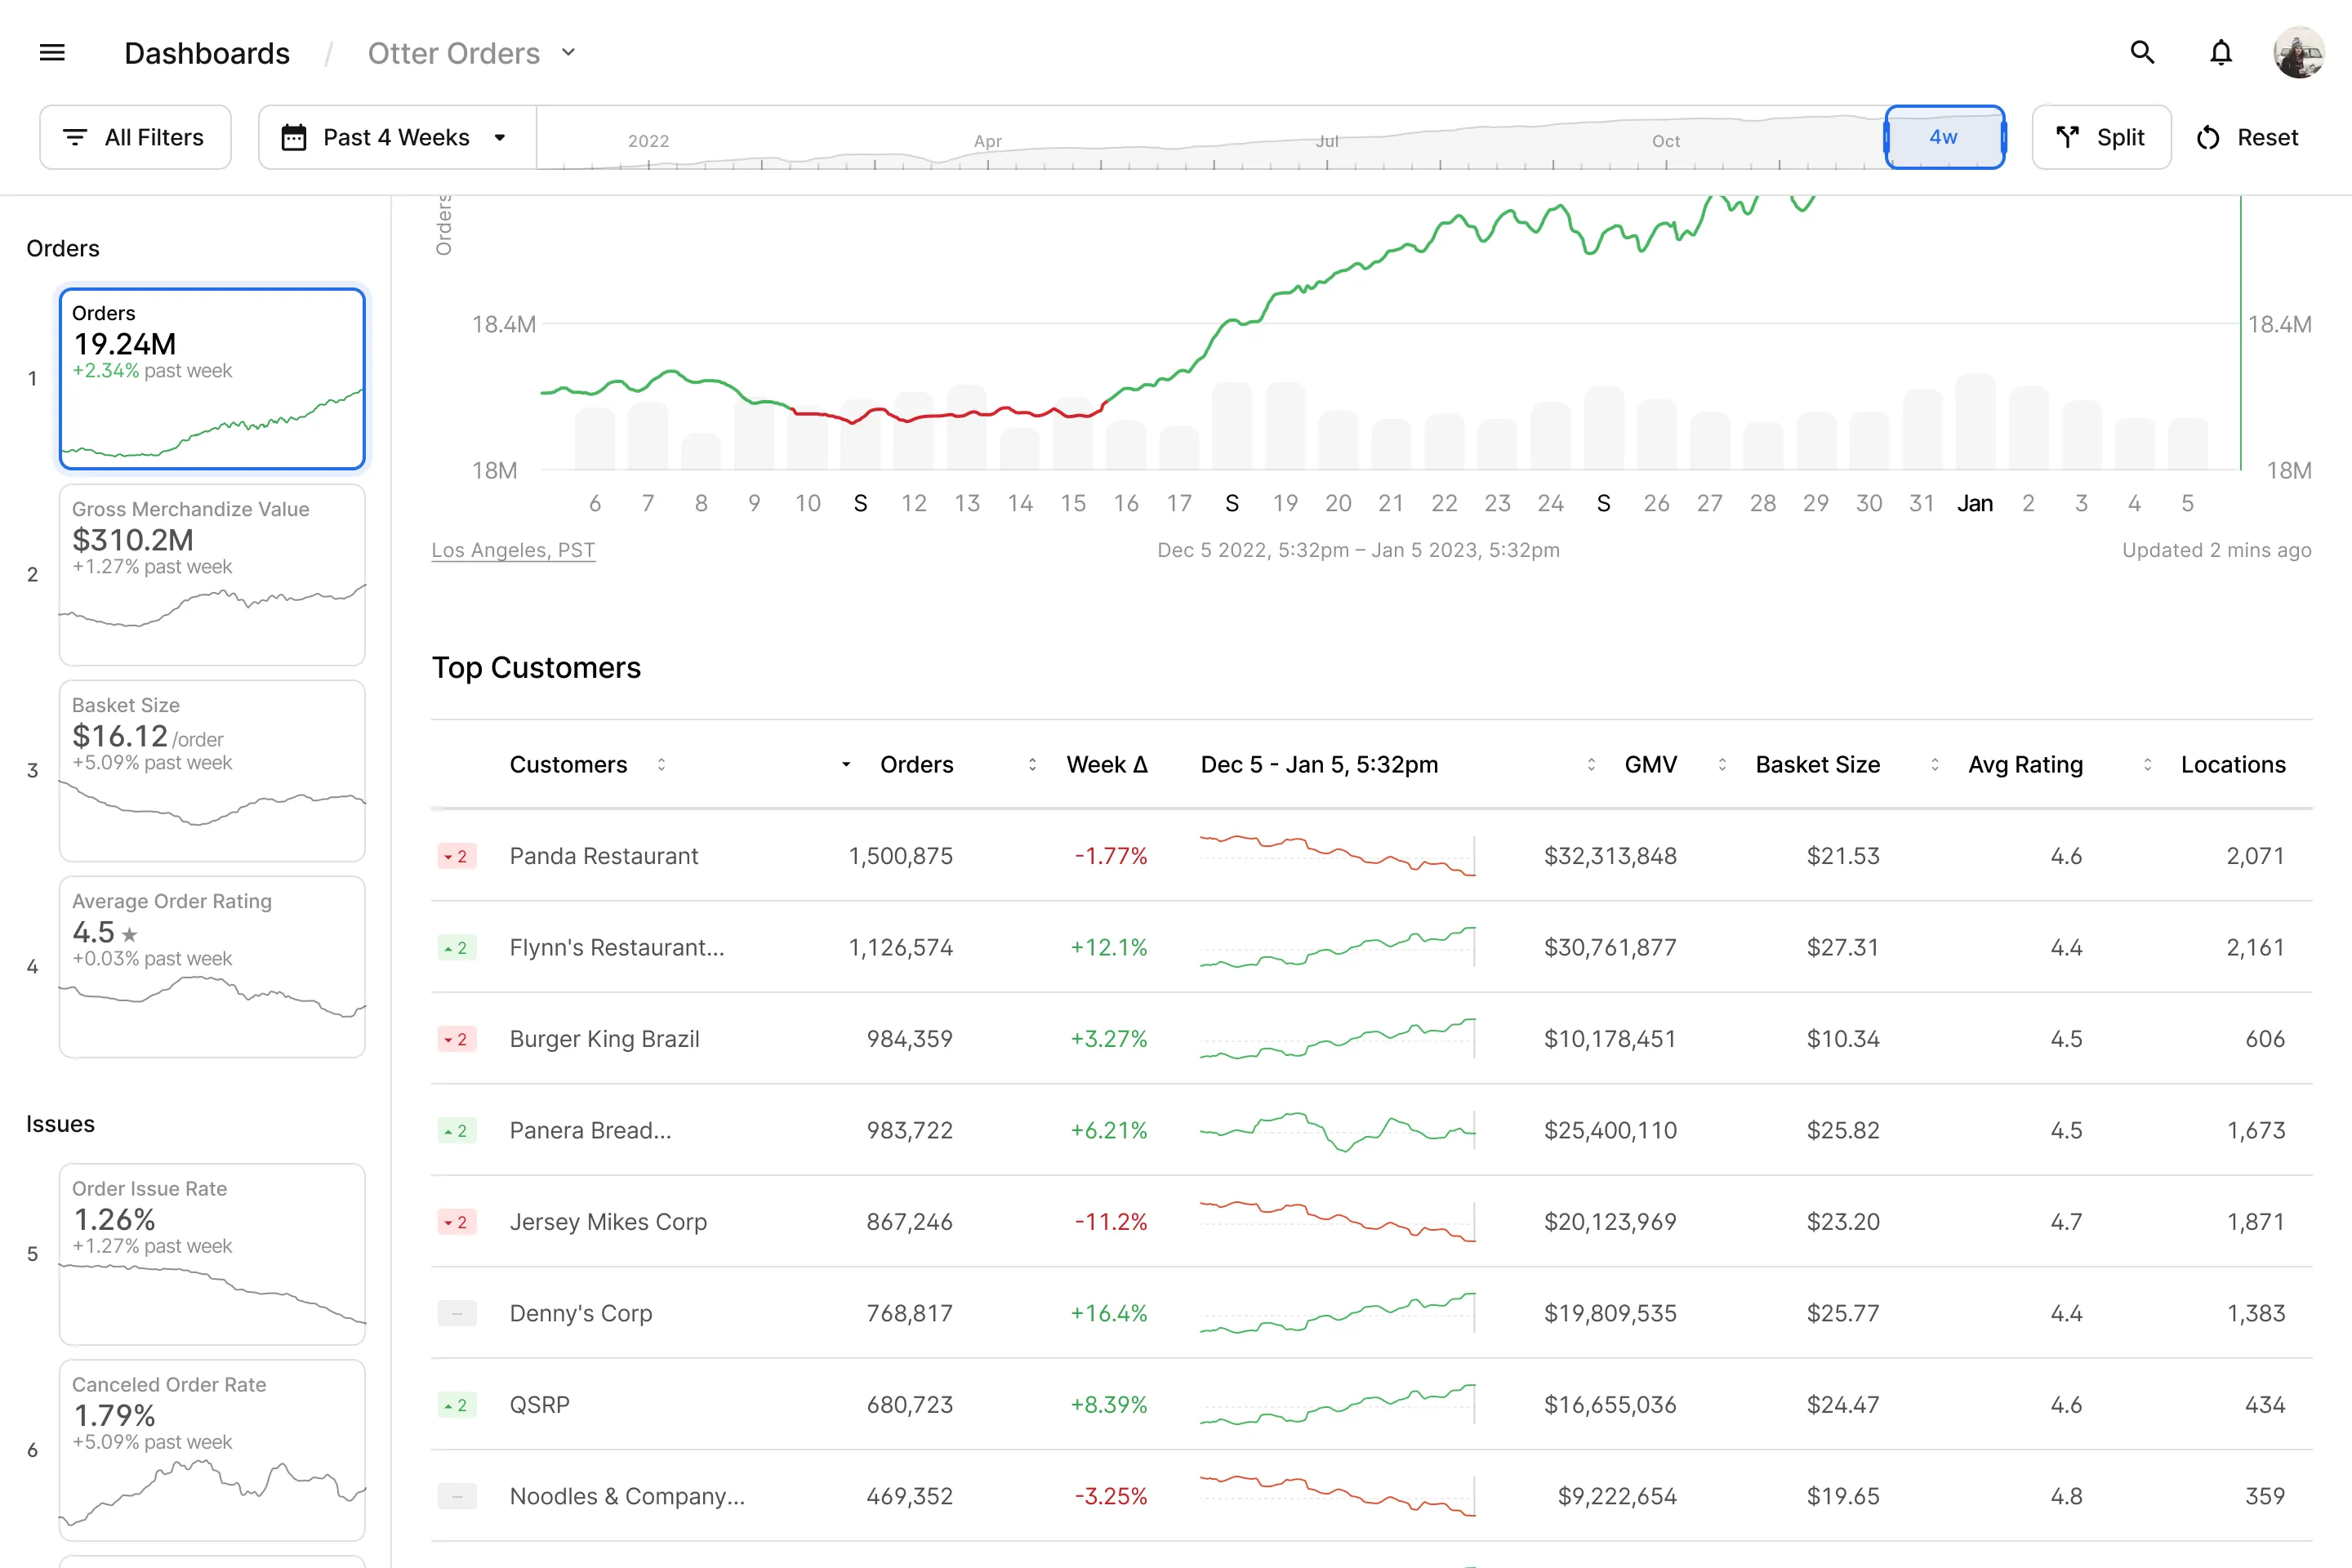
A dashboard framework: a component system covering chart types, filter bars, date range pickers, split views, comparison modes and settings panels, with hover, loading, empty and error states specified for each. Designers and engineers stopped debating the pieces and spent their time on which questions a board should answer.
The states are the system
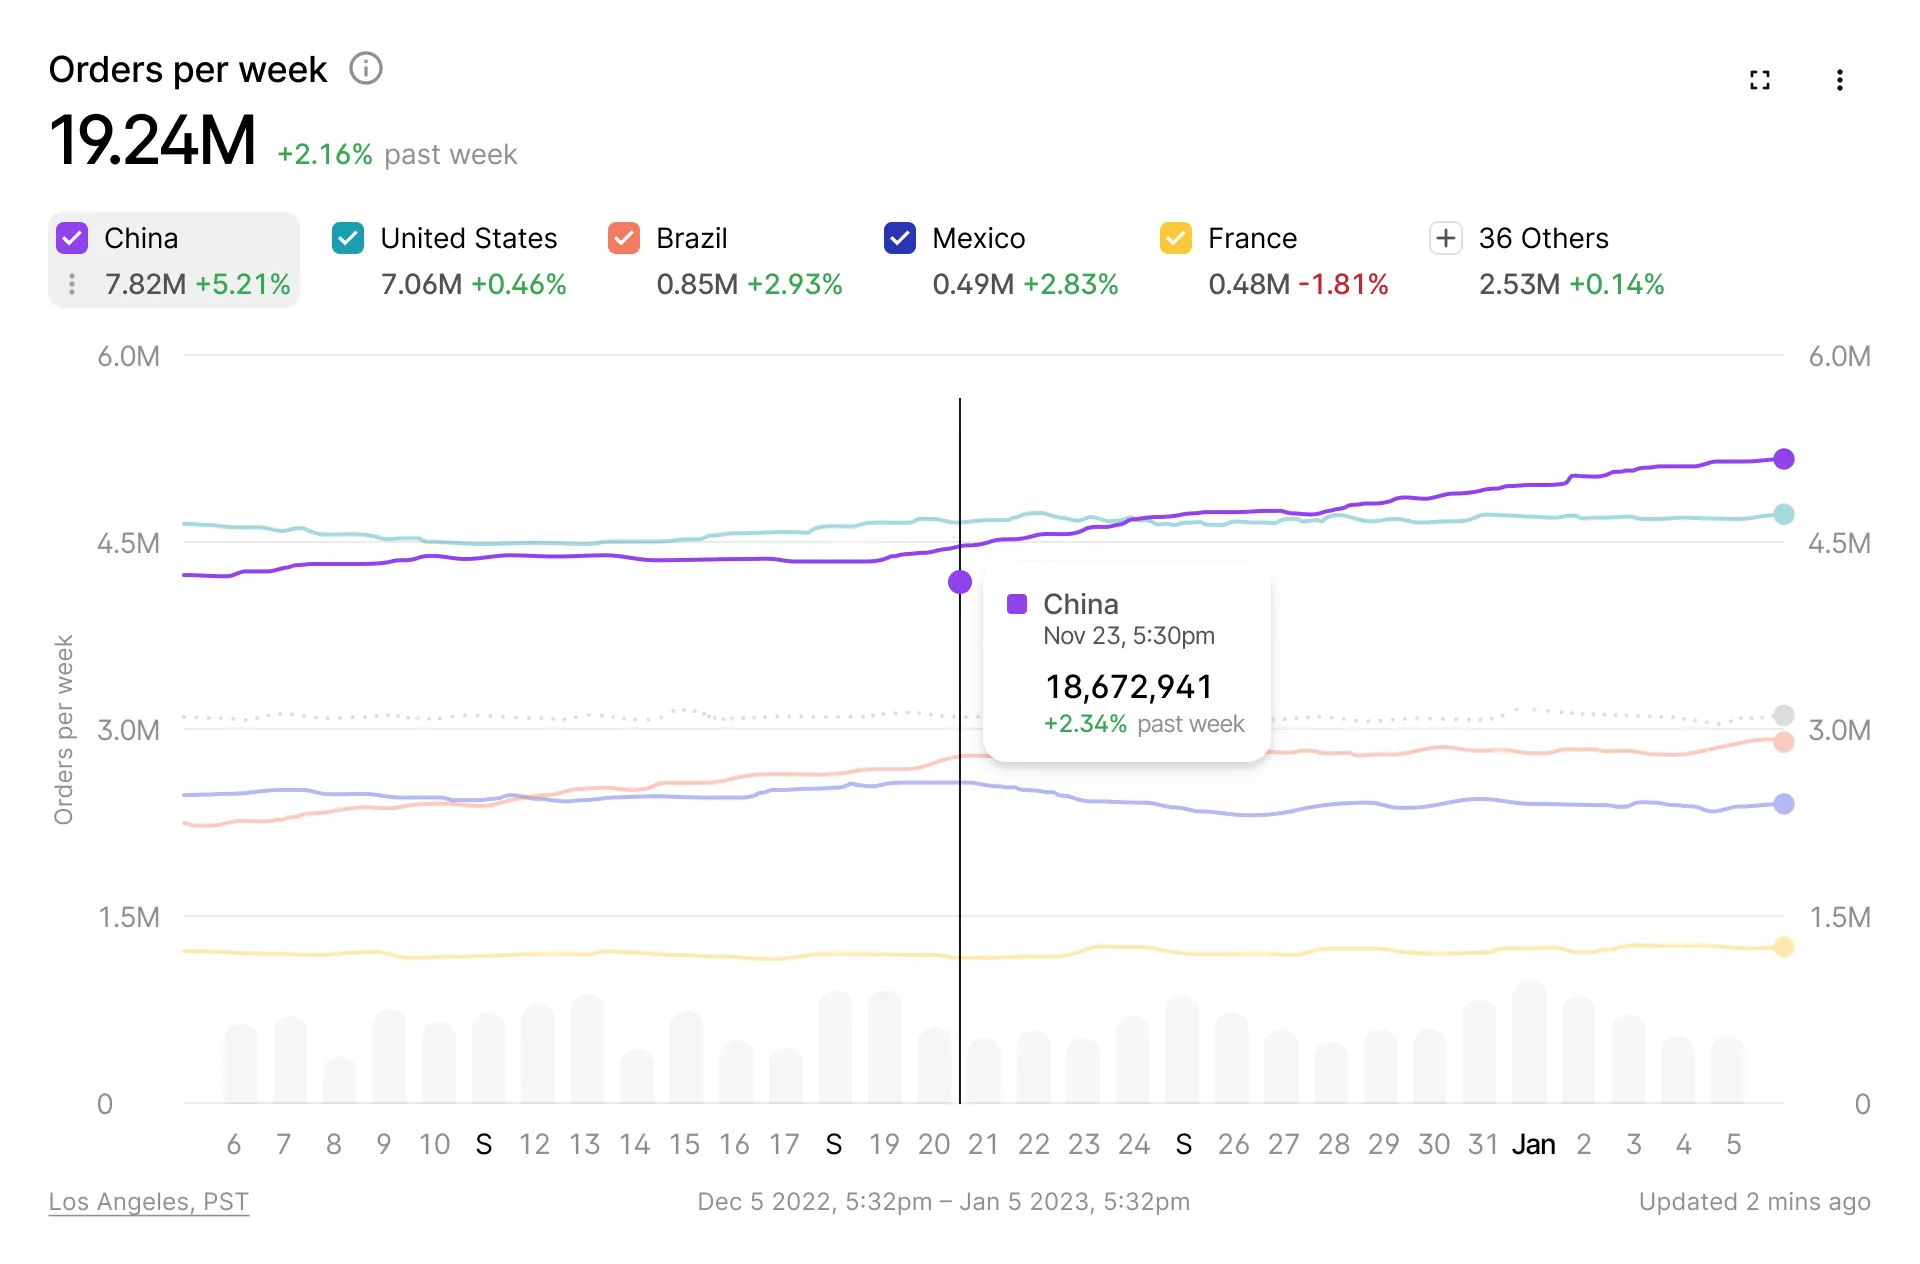
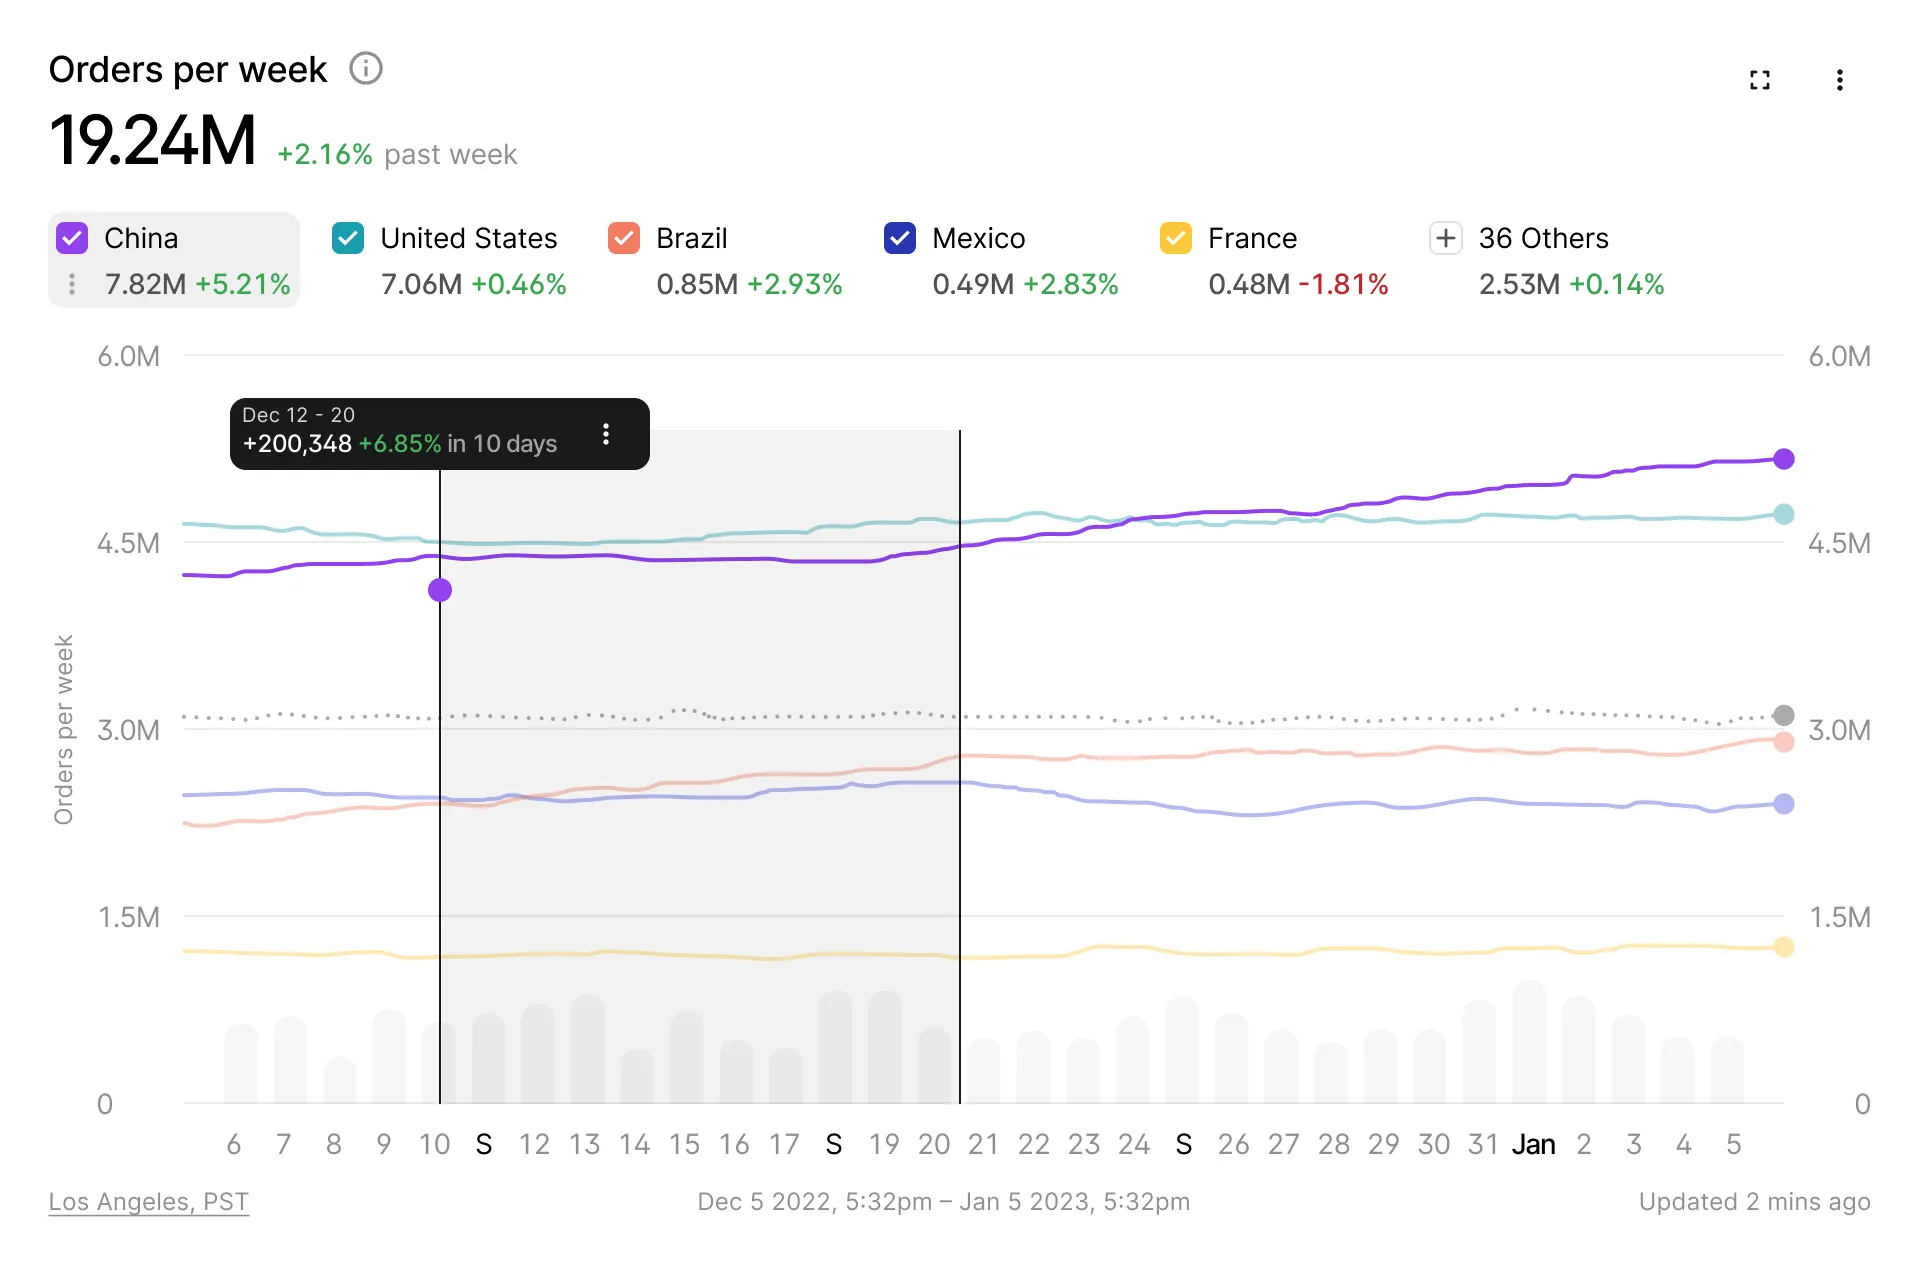
A chart type is easy. A chart type whose hover, range selection, comparison and empty states all behave identically across fifty boards is a framework.
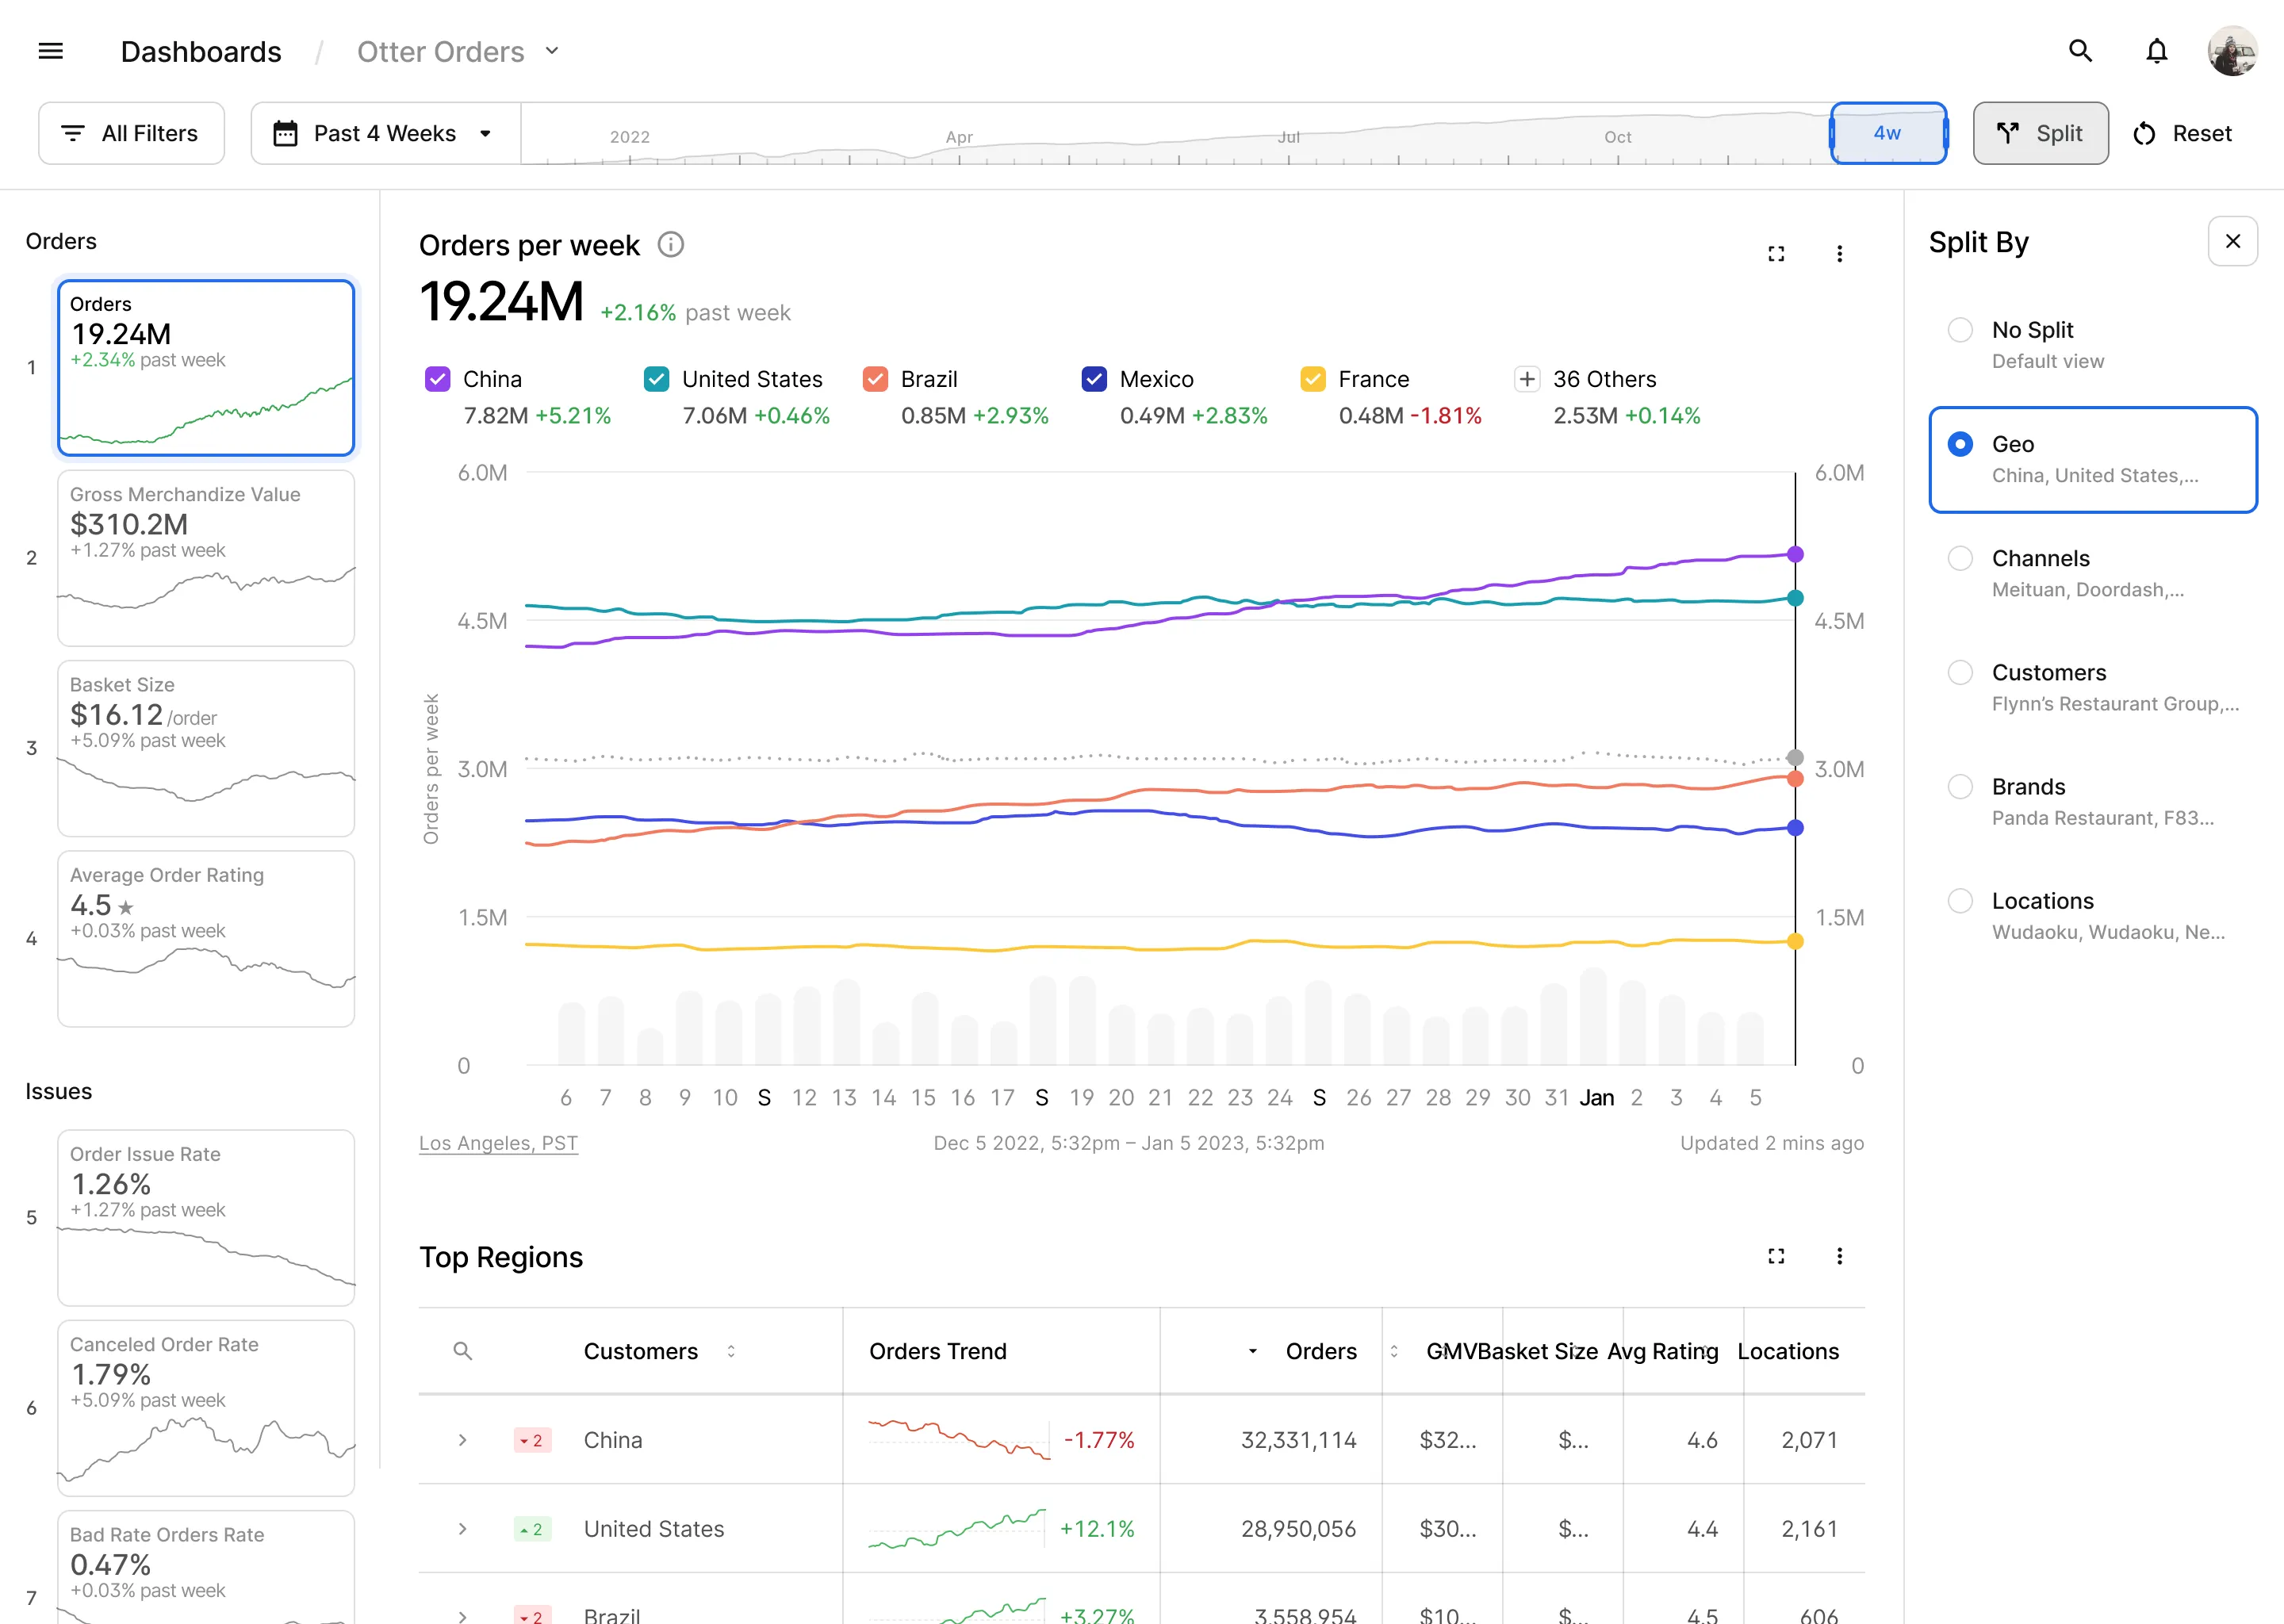
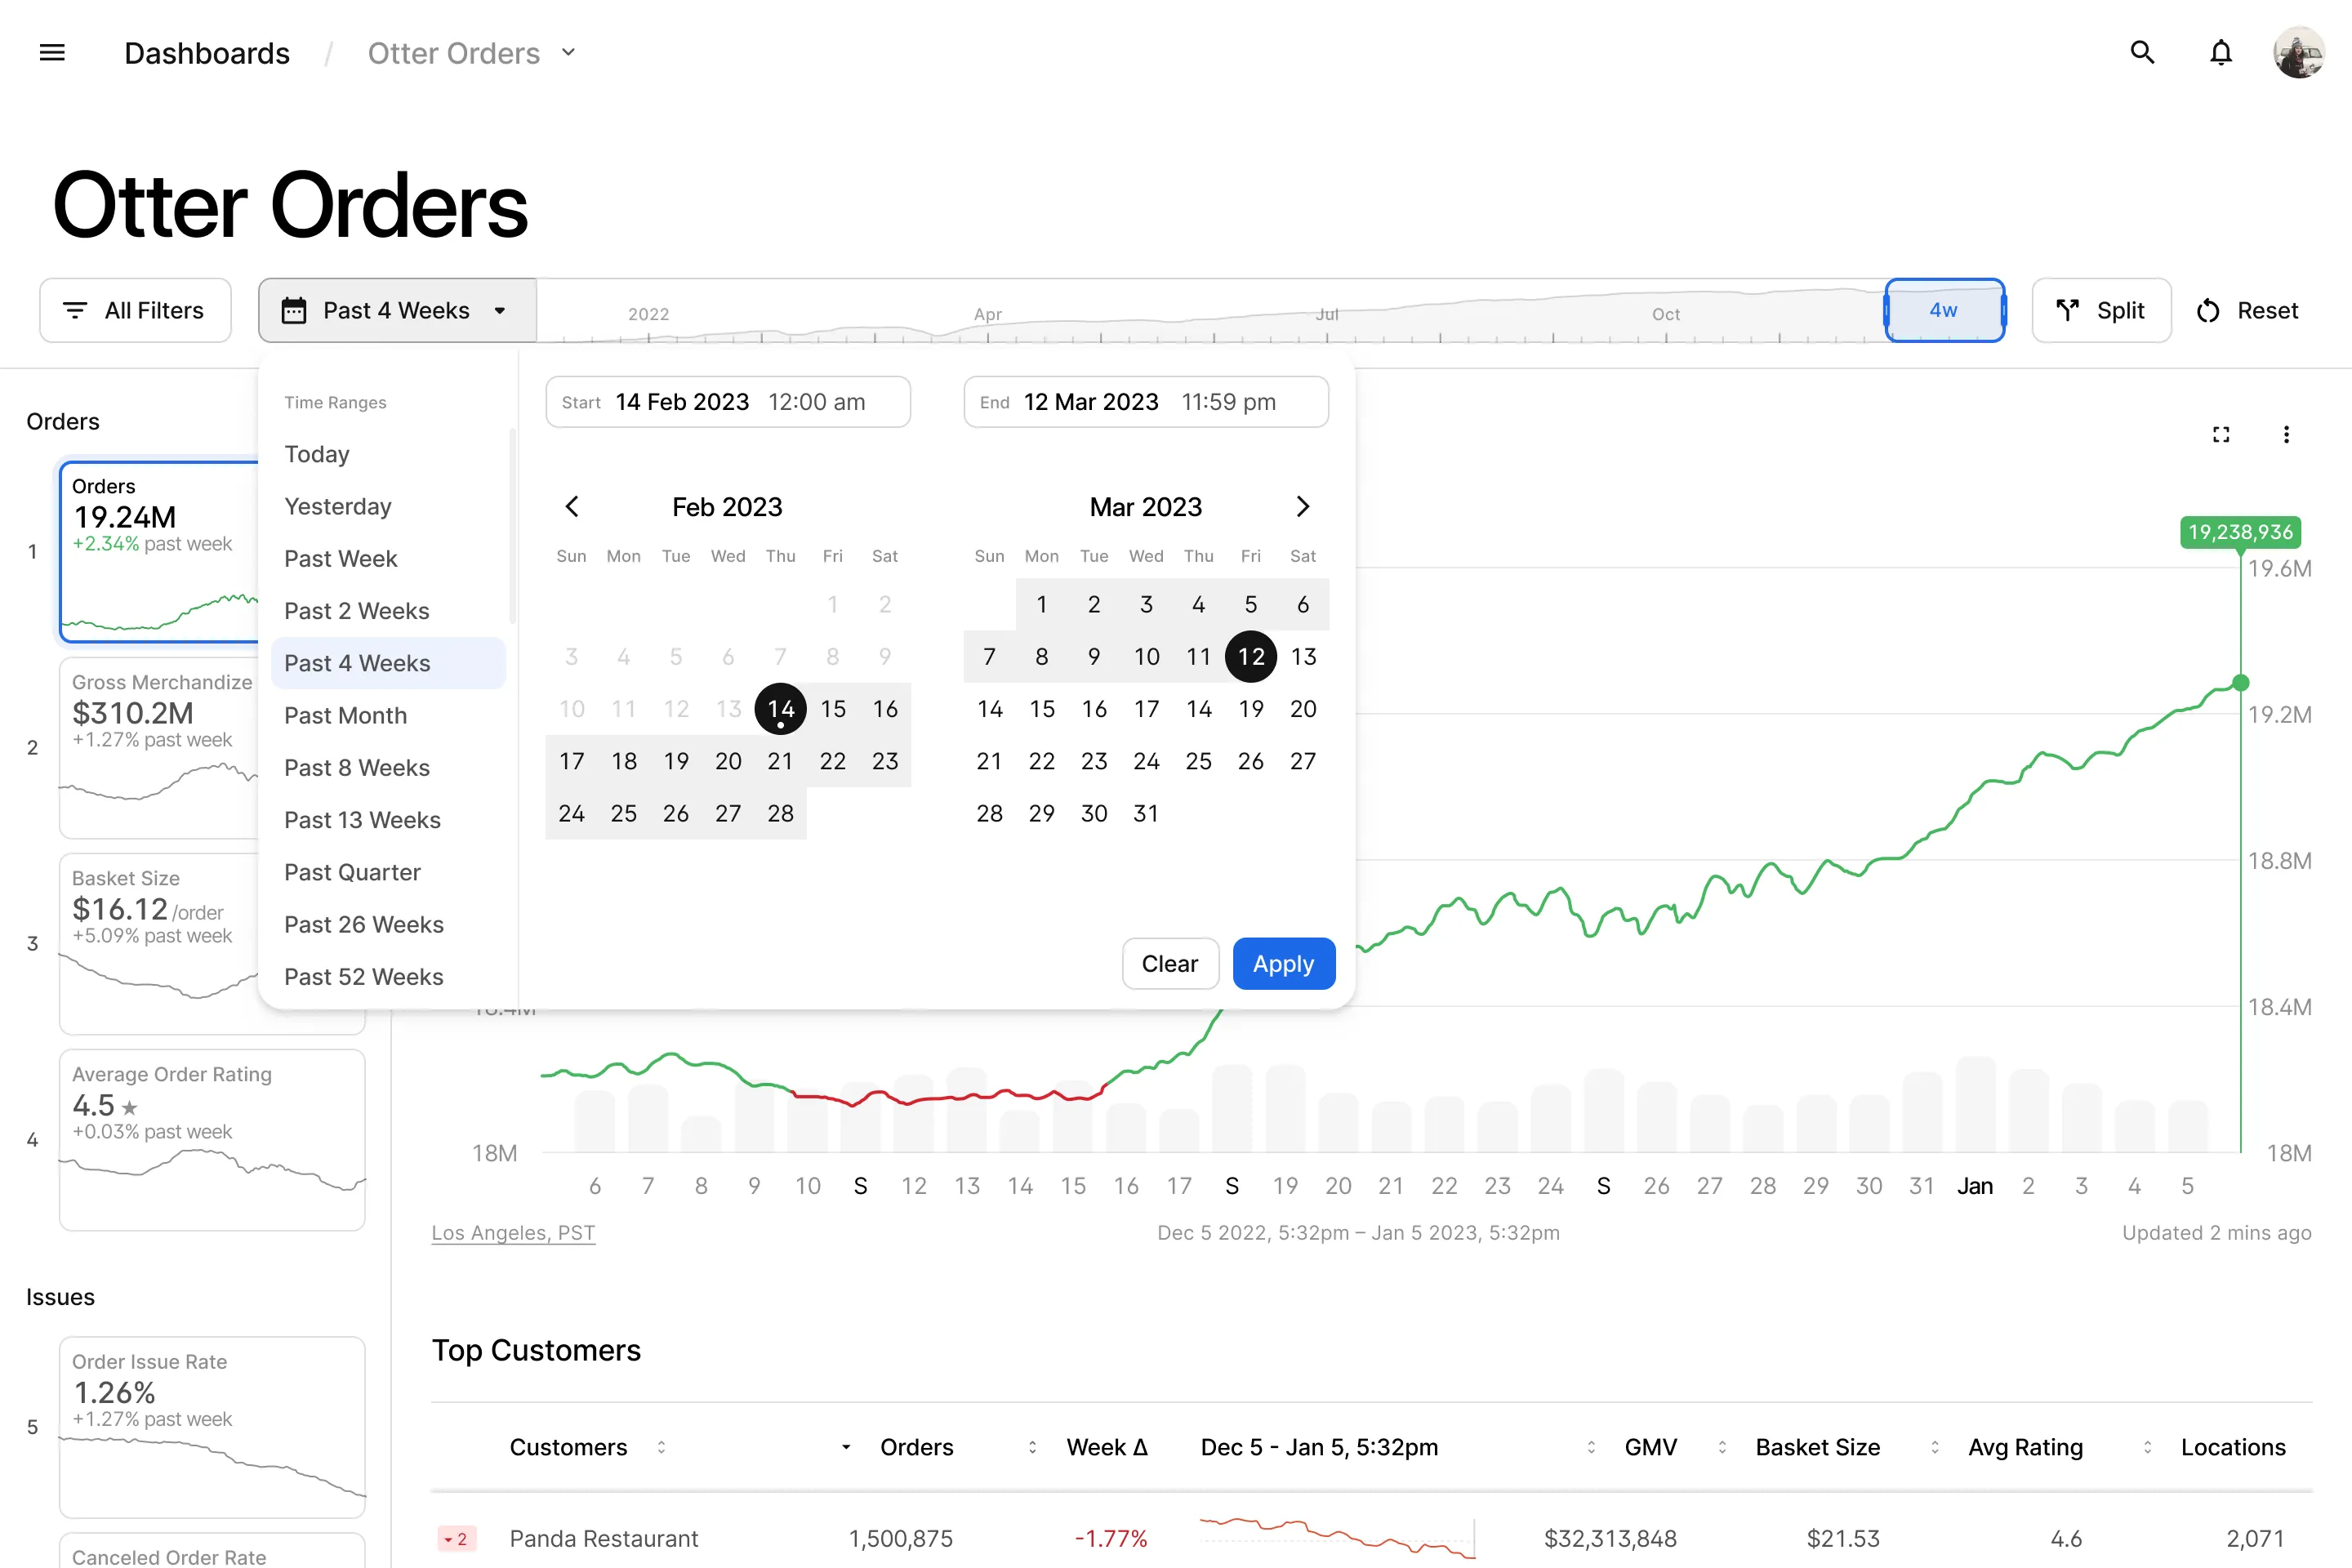
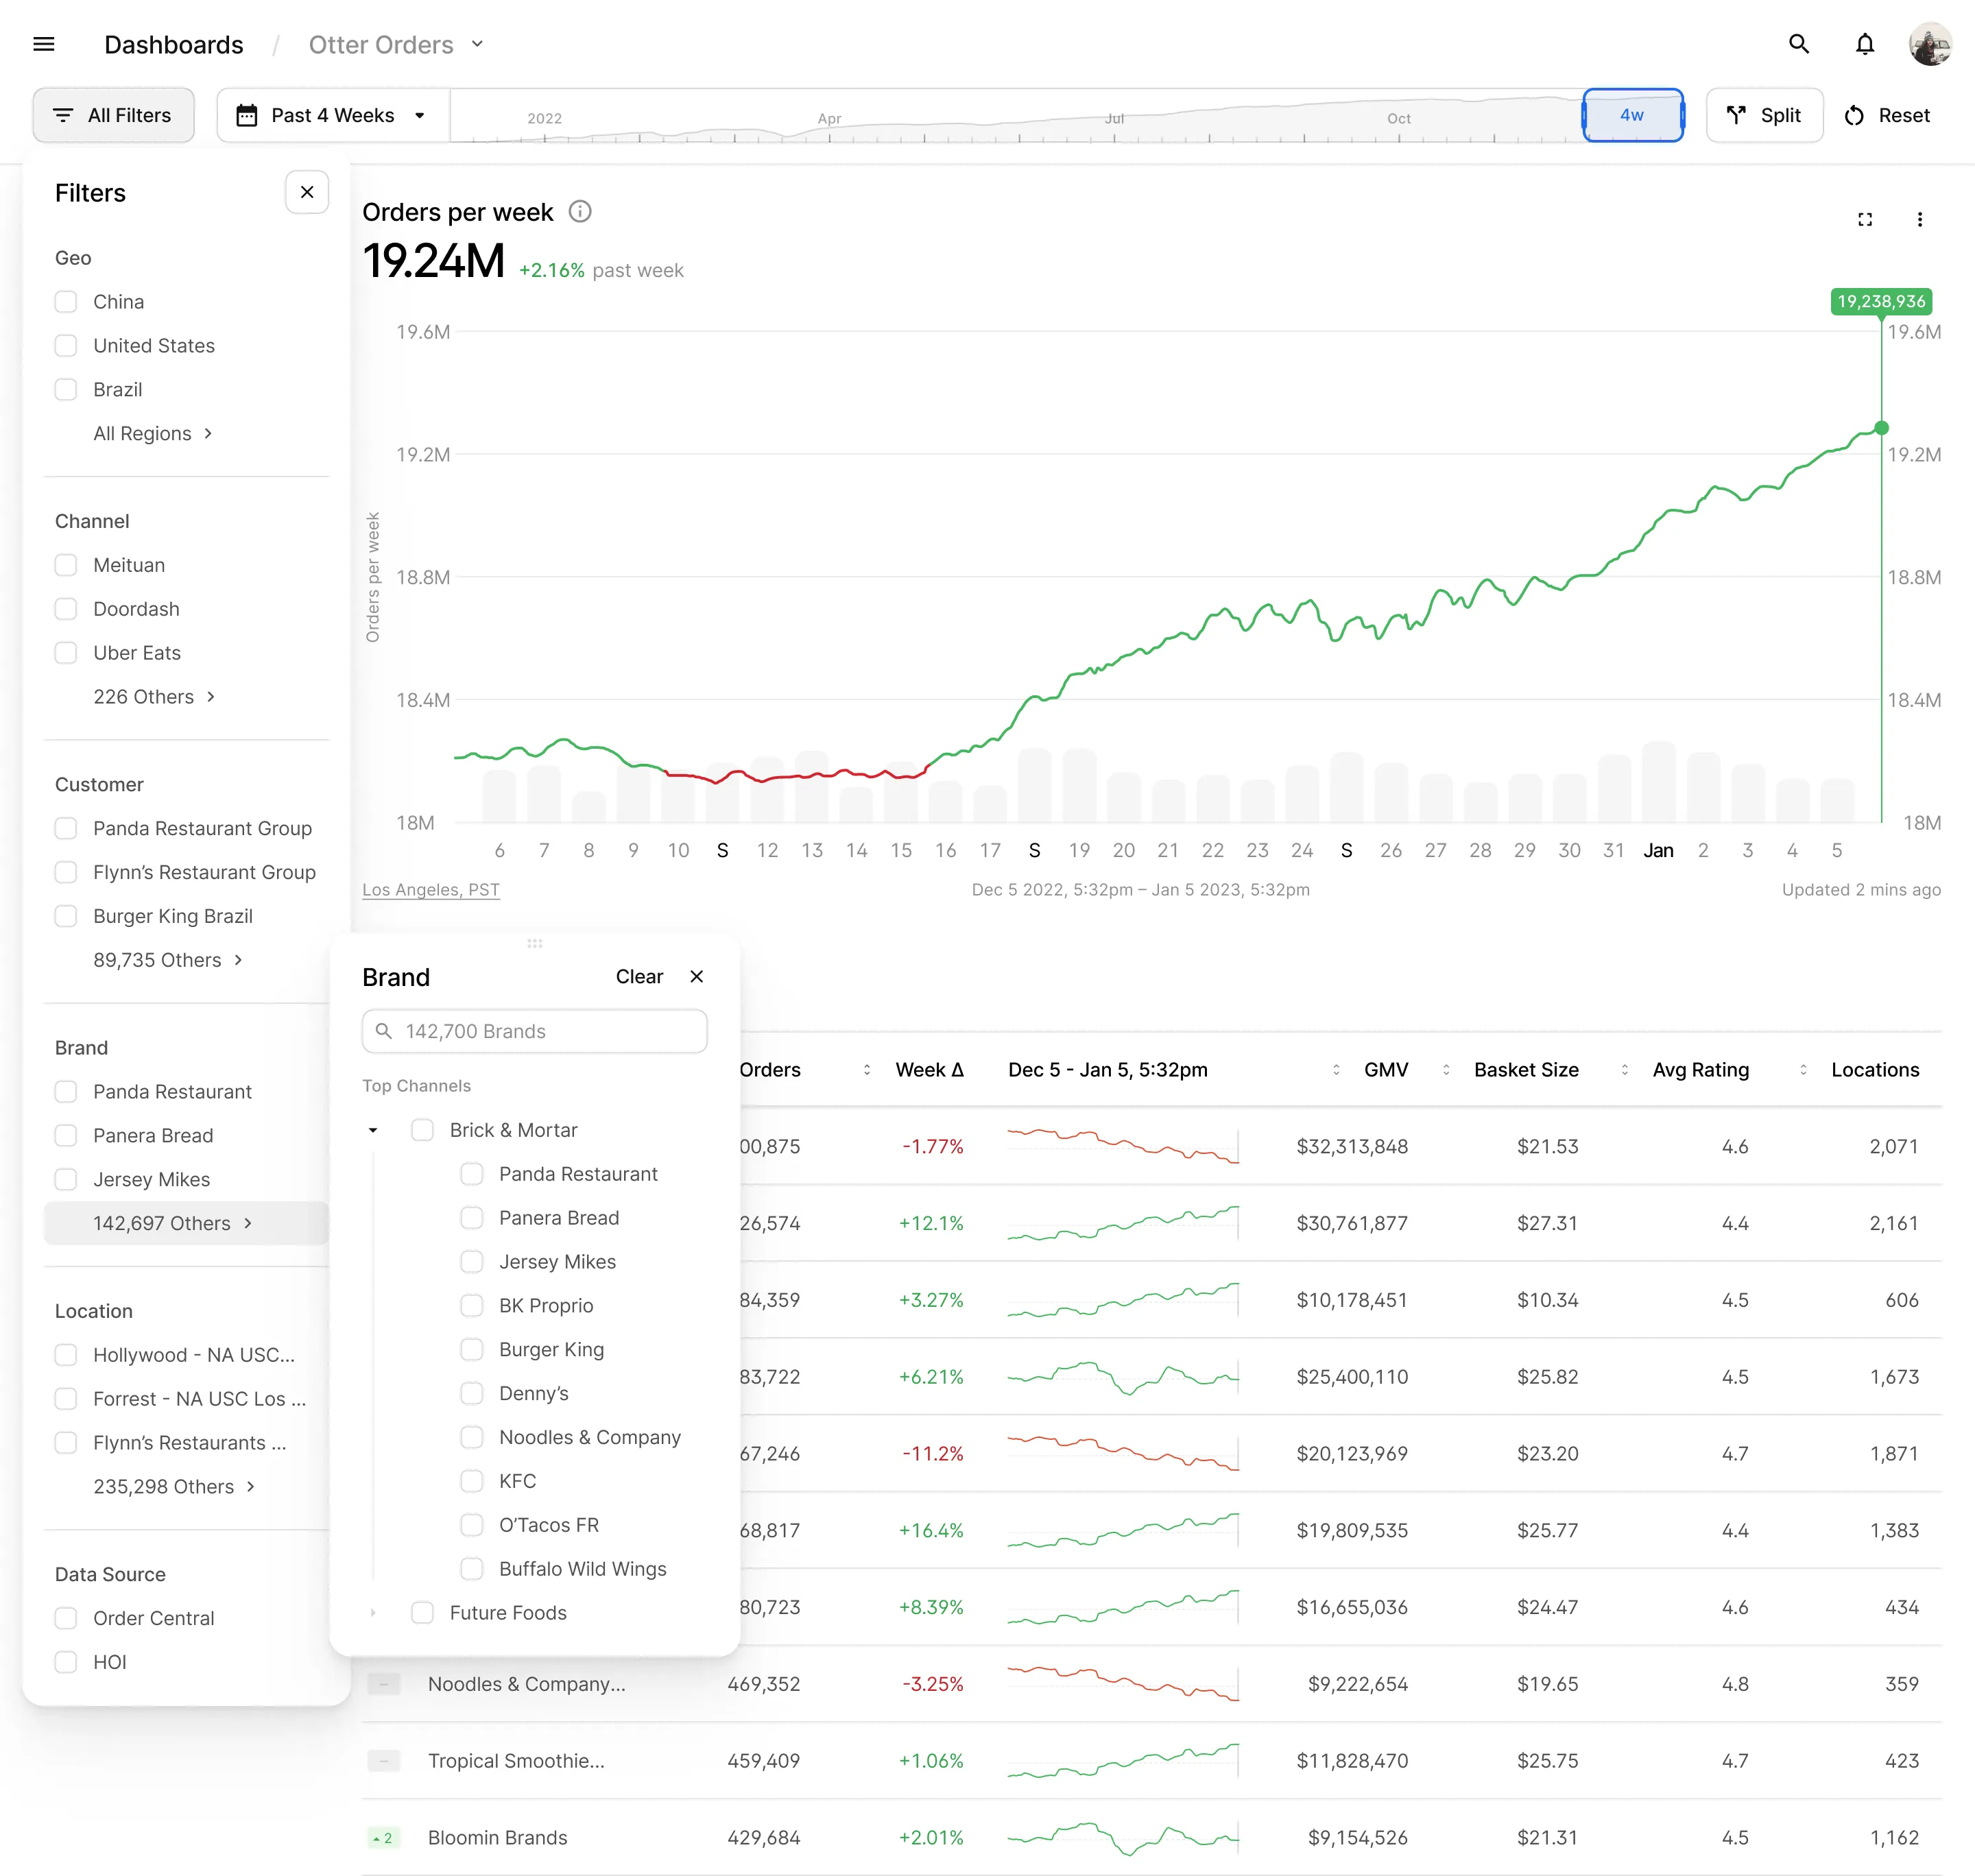
This is the design-systems layer of the analytics work. Analytics Studio is the product built on top of it.
Impact
New dashboards went from a design project to an assembly task. Consistency stopped being a review comment and became a property of the system.